Support and Resistance in Forex: How to Find and Use Levels
Support is a price area where a falling market has repeatedly stopped and turned up; resistance is an area where a rising market has stopped and turned down. Traders find them from earlier swing highs and lows, round numbers and the previous day's range. They are zones rather than exact lines, they can switch roles after a breakout, and any level can fail.
Key takeaways
- Support is an area where falling prices have stopped before; resistance is an area where rising prices have stopped before.
- Levels are commonly marked at earlier swing highs and lows, round numbers and recent ranges; a level where price has turned several times is usually easier to see.
- Support and resistance are zones a few pips wide, not exact prices.
- After a breakout, old resistance can act as support and old support as resistance, but levels can fail, and price can break a level and quickly return.
- A stop placed just beyond the zone, with the position sized from that distance, limits the planned loss if the level breaks.
At a glance
- Support
- Where falls have stopped
- Resistance
- Where rises have stopped
- Drawn as
- Zones, not lines
- After a breakout
- Roles can switch
What are support and resistance?
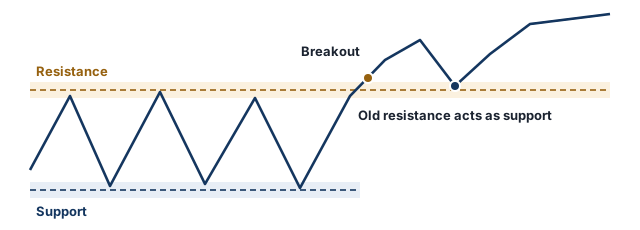
Support is a price area where a falling market has stopped and turned up, more than once. Resistance is an area where a rising market has stopped and turned down. The idea behind both is simple: at those prices, buyers (at support) or sellers (at resistance) have been strong enough to stop the move before, and these areas are commonly marked on charts.
Support and resistance describe the past. They do not mean price must turn there again; they mark where a reaction is more likely to be watched, and where a trade can be planned with a clear point at which it is wrong.
How to find support and resistance levels
- Swing highs and lows: look for prices where the market turned more than once. Two or three clear turns in the same area make a level easier to see.
- Round numbers: prices such as 1.1000 on EUR/USD or 150.00 on USD/JPY are commonly marked by traders.
- Recent ranges: the previous day’s and previous week’s high and low.
- Higher timeframes first: levels on daily and weekly charts are often treated as more significant. Mark them first, then use a lower timeframe to refine them.
- Moving averages: some traders also treat a widely used moving average as dynamic support or resistance: moving averages.
Why levels are zones, not lines
Price rarely turns at exactly the same price twice. Spreads differ between brokers, and on lower timeframes the noise is larger. Drawing a zone a few pips wide around the turning points fits the chart better than one exact line, and it is a reminder that price can poke through a level briefly without the level failing: what is a spread in forex.
Breakouts, false breakouts and role reversal
When price closes clearly beyond a level, it is a breakout. Two things can follow:
- Role reversal: old resistance can become support, and old support can become resistance. A pullback to the broken level is often called a retest; some traders wait for it to see whether the new role holds.
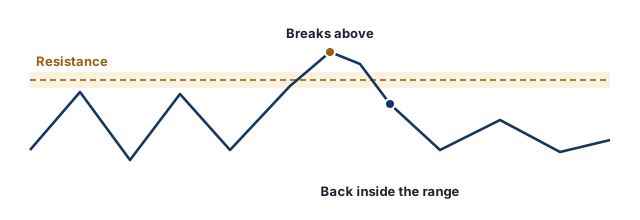
- False breakout: price moves beyond the level and then quickly returns inside the range. Some traders consider these more likely around news releases or in quiet hours, and some wait for a candle close beyond the zone or for a retest instead of entering on the first move.
Neither outcome can be known in advance; the chart shows which one happened only afterwards.
How to use support and resistance with a stop loss
A level gives a natural place for the stop: a trade bought near support is wrong if price closes well below that support. Placing the stop a few pips beyond the zone, and sizing the position from that distance, limits the planned loss if the level breaks: stop loss.
A long trade near support (illustrative prices)
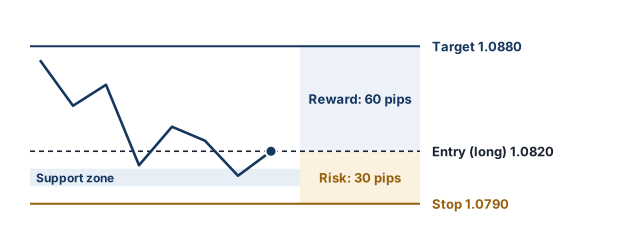
Assumptions: $10,000 US dollar account; risk 1% ($100) per trade; EUR/USD support zone 1.0800 to 1.0810 and resistance near 1.0880 (illustrative prices); entry at 1.0820; stop at 1.0790, below the zone; target at 1.0880; one pip on 1 standard lot is worth $10; spread, commission and swap excluded.
- Stop distance: 1.0820 − 1.0790 = 30 pips. Target distance: 1.0880 − 1.0820 = 60 pips, a 1:2 risk-reward ratio.
- Position size: $100 ÷ (30 pips × $10) ≈ 0.333, rounded down to 0.33 lots.
- If the stop is hit: 30 × $10 × 0.33 = $99 loss. If the target is hit: 60 × $10 × 0.33 = $198 profit.
Gaps and slippage can make a loss larger than planned. Size calculations: position size calculator, risk-reward ratio.
Limits of support and resistance
- Hindsight: levels look clearer on a past chart than in real time.
- Subjectivity: two traders can draw different levels on the same chart.
- No forecast: a level that held three times can break on the fourth. A 2007 review of research in the Journal of Economic Literature found technical analysis widespread in the foreign exchange market and reported that it “may be profitable”; that is not evidence that a given level or rule will work for a retail trader after costs.
Write down in advance which levels you trade, where the stop goes and how much you risk: trading plan.
Free email course
Forex Risk Management in 5 Days
A free five-day email course: risk per trade, stop losses, position sizing, risk-reward and drawdowns, with a worked example each day.
Frequently asked questions
What is support and resistance in forex?
Support is a price area where a falling market has repeatedly stopped and turned up; resistance is an area where a rising market has stopped and turned down. They show where buyers or sellers have been active before, not where price must turn.
How do you find support and resistance levels?
Mark earlier swing highs and lows where price turned more than once, round numbers such as 1.1000 on EUR/USD, and the previous day's or week's high and low. Start on a higher timeframe, such as daily, then refine on a lower one.
Why are support and resistance zones and not lines?
Price rarely turns at exactly the same price twice, and spreads differ between brokers. A zone a few pips wide around the turning points fits what the chart shows better than a single line.
What happens when support breaks?
Price may keep falling, and the old support area can act as resistance if price comes back up to it. But some breaks reverse quickly; these false breakouts are one reason traders wait for a close beyond the zone or a retest.
Which timeframe is best for support and resistance?
There is no single best one. Levels on daily and weekly charts are often treated as more significant; levels on 5-minute or 15-minute charts are more numerous and are crossed more often.
Does support and resistance work?
Levels describe where price has turned before; they do not predict that it will turn again. A 2007 review of research on currency markets found technical analysis widespread and reported that it may be profitable; that does not show a given level or rule works after costs. Treat a level as a place to plan risk, not as a signal.
Sources
Regulatory and official sources
- The Obstinate Passion of Foreign Exchange Professionals: Technical Analysis (Journal of Economic Literature, 2007), American Economic Association
Industry and news sources
- Support and Resistance, StockCharts ChartSchool
Related articles
- Moving Averages in Forex: SMA vs EMA, Periods and Crossovers
Moving averages in forex explained: how SMA and EMA are calculated, worked examples, common periods (20, 50, 200), crossovers, golden cross and their limits.
- RSI Indicator Explained: Formula, 70 and 30 Levels, Divergence
The RSI indicator explained: how the Relative Strength Index is calculated step by step, what 70 and 30 mean, the 14-period setting, divergence and its limits.
- Stop Loss in Forex: How to Set One and Where to Place It
How a stop loss works in forex, how to set one step by step, common ways to choose the stop level, and why a stop can close at a worse price.
- Risk-Reward Ratio in Forex: How to Calculate It, With Examples
What the risk-reward ratio is, how to calculate it for long and short trades, the break-even win rate for each ratio, and why a high ratio alone is not enough.
- Position Sizing in Forex: How Many Lots Should You Trade?
How to calculate position size in forex from your risk amount, stop loss distance and pip value, with worked examples for EUR/USD and USD/JPY.
- Forex Trading Plan: How to Write One, With a Template
What a forex trading plan is and how to write one: what it should include, risk rules, a fill-in template, an example plan and how to test and update it.
- Fibonacci Retracement in Forex: Levels, How to Draw, Example
Fibonacci retracement explained: where 23.6%, 38.2%, 50% and 61.8% come from, how to draw the levels and calculate them, a EUR/USD example and the limits.
- Candlestick Patterns: How to Read Forex Candlestick Charts
Candlestick patterns explained: how to read a candle (open, high, low, close), doji, hammer, shooting star and engulfing patterns, confirmation and limits.
Glossary terms
- Stop loss
A stop loss is an order that closes a position automatically if the price moves against you to a set level. It is designed to limit the loss on a trade, but it does not guarantee the exit price.
- Take profit
A take profit is an order that closes a position automatically when the price reaches a set profit target.
- Slippage
Slippage is the difference between the price you expect when placing an order and the price at which it is actually filled. It can work against you (negative slippage) or in your favour (positive slippage).
- Volatility
Volatility is how much and how quickly a currency pair’s price moves over a period. Higher volatility means larger price swings and, for the same position size, greater risk.
First published 18 October 2026. Last fact-checked 18 October 2026.This article is for educational purposes only and is not investment advice.