Moving Averages in Forex: SMA vs EMA, Periods and Crossovers
A moving average is the average closing price over a set number of periods, recalculated with each new candle, so it smooths price into a line. The simple moving average (SMA) weights every period equally; the exponential moving average (EMA) gives recent prices more weight and reacts faster. Traders use them to see the trend, as dynamic support or resistance, and in crossovers. All moving averages lag price.
Key takeaways
- A moving average is the average closing price over the last n periods; it smooths price and helps show the direction of the trend.
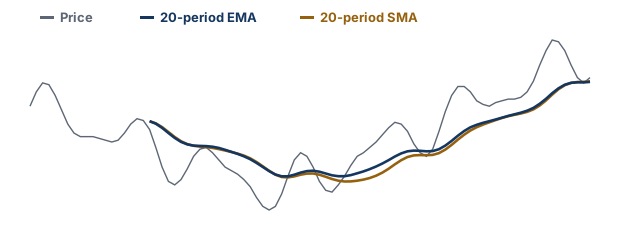
- The SMA weights every period equally; the EMA weights recent prices more, so it reacts faster and also turns more often.
- Common periods are 20, 50, 100 and 200; none is best, and longer averages move more slowly.
- A crossover is when a faster average crosses a slower one; the 50 and 200-period cross is called a golden cross (upwards) or death cross (downwards).
- Moving averages lag price, so crossovers come after a turn, and in sideways markets they give many false crosses.
At a glance
- SMA
- Every period weighs the same
- EMA
- Recent prices weigh more
- Common periods
- 20, 50, 100, 200
- Main limit
- Lags the price
What is a moving average?
A moving average is the average closing price of a market over a set number of periods, recalculated each time a new candle closes. On a 1-hour chart, a 20-period moving average is the average of the last 20 hourly closes; on a daily chart, the last 20 daily closes. Plotted as a line, it smooths out short-term swings and makes the direction of the trend easier to see.
There are two common types: the simple moving average (SMA) and the exponential moving average (EMA).
Simple moving average (SMA)
The SMA adds the last n closing prices and divides by n. Every period has the same weight.
SMA = (C₁ + C₂ + … + Cₙ) ÷ n · C = closing price, n = number of periods
A 5-period SMA
Assumptions: five EUR/USD closes of 1.0800, 1.0820, 1.0810, 1.0840 and 1.0830 (illustrative prices).
- SMA = (1.0800 + 1.0820 + 1.0810 + 1.0840 + 1.0830) ÷ 5 = 5.4100 ÷ 5 = 1.0820.
- The next candle closes at 1.0860. The oldest close (1.0800) drops out: (1.0820 + 1.0810 + 1.0840 + 1.0830 + 1.0860) ÷ 5 = 1.0832.
Exponential moving average (EMA)
The EMA gives recent prices more weight. Each new value moves the previous EMA part of the way towards the latest close, using a multiplier that depends on the period.
EMA = C × k + previous EMA × (1 − k) · k = 2 ÷ (n + 1)
A 5-period EMA
Assumptions: the same closes as above; the first EMA value is taken as the 5-period SMA, 1.0820; the next close is 1.0860.
- Multiplier: k = 2 ÷ (5 + 1) = 1/3.
- EMA = 1.0860 × 1/3 + 1.0820 × 2/3 ≈ 1.08333, closer to the latest close than the SMA’s 1.0832.
Platforms start the EMA in slightly different ways, so early values can differ between platforms; after enough periods they converge.
SMA vs EMA
| SMA | EMA | |
|---|---|---|
| Weighting | Every period equal | Recent periods weigh more |
| Reaction to a turn | Slower | Faster |
| False turns in sideways markets | Fewer | More |
Common moving average periods
Periods of 20, 50, 100 and 200 are among the most commonly used. Short averages follow price closely; the 200-period average on a daily chart is often used as a broad gauge of the long-term trend. No period is best in general, and an average that suited one pair or timeframe in the past may not suit another.
Moving average crossovers
A crossover is when a faster average crosses a slower one. A fast average crossing above a slow one shows that recent prices have risen above the longer-term average; crossing below shows the reverse. On daily charts the 50 and 200-period cross has its own names: a golden cross when the 50 crosses above the 200 and a death cross when it crosses below.
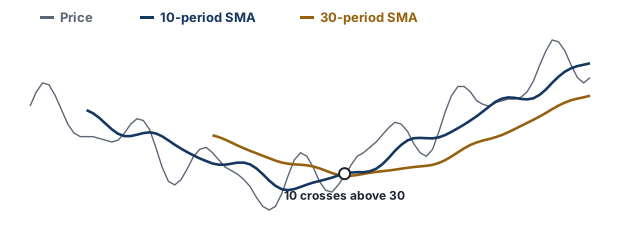
Because both lines are averages of past prices, a crossover always comes after the price has turned, sometimes long after. In sideways markets the lines cross back and forth, giving many false crosses.
How traders use moving averages
- Trend direction: price above a rising average suggests an uptrend; below a falling average, a downtrend.
- Dynamic support and resistance: in a trend, price sometimes pulls back to a widely watched average before continuing: support and resistance.
- Filters: some traders only take trades in the direction of a long average, and use other tools for timing: RSI indicator.
Whatever the use, the rules belong in a written plan, with a stop and position size set before entry: trading plan, stop loss.
Limits of moving averages
- Lag: averages describe past prices; they do not forecast.
- Whipsaws: in ranges, price and averages cross repeatedly.
- Research: a 2007 review in the Journal of Economic Literature found technical analysis widespread in currency markets and reported that it “may be profitable”. It does not show that a particular average or crossover rule works for a retail trader after costs.
Free email course
Forex Risk Management in 5 Days
A free five-day email course: risk per trade, stop losses, position sizing, risk-reward and drawdowns, with a worked example each day.
Frequently asked questions
What is a moving average in forex?
The average closing price of a currency pair over a set number of periods, such as the last 20 candles, recalculated with each new candle. Plotted as a line, it smooths out short-term swings.
What is the difference between SMA and EMA?
A simple moving average (SMA) gives every period the same weight. An exponential moving average (EMA) gives recent prices more weight, so it follows the price more closely and reacts sooner to a change, at the cost of more false turns.
Which moving average is best for forex?
There is no best one. Short averages (such as 10 or 20 periods) follow price closely and turn often; long ones (100 or 200) are smoother and slower. The right choice depends on the timeframe and the trading plan, and should be tested before real money is used.
What is a golden cross?
When a 50-period moving average crosses above a 200-period one, usually on a daily chart. The opposite, the 50 crossing below the 200, is called a death cross. Both come well after the price has turned, and neither guarantees that the trend continues.
What does the 200-day moving average mean?
It is the average close of the last 200 daily candles. It is commonly used as a broad gauge of the long-term trend: price above it in an uptrend, below it in a downtrend. Price sometimes pauses near it, but it is not a fixed level.
How do you calculate a simple moving average?
Add the last n closing prices and divide by n. With closes of 1.0800, 1.0820, 1.0810, 1.0840 and 1.0830, the 5-period SMA is 5.4100 ÷ 5 = 1.0820.
Sources
Regulatory and official sources
- The Obstinate Passion of Foreign Exchange Professionals: Technical Analysis (Journal of Economic Literature, 2007), American Economic Association
Industry and news sources
- Moving Averages: Simple and Exponential, StockCharts ChartSchool
Related articles
- Support and Resistance in Forex: How to Find and Use Levels
Support and resistance in forex explained: how to find levels on a chart, why they are zones, breakouts and false breakouts, and placing a stop with an example.
- RSI Indicator Explained: Formula, 70 and 30 Levels, Divergence
The RSI indicator explained: how the Relative Strength Index is calculated step by step, what 70 and 30 mean, the 14-period setting, divergence and its limits.
- Stop Loss in Forex: How to Set One and Where to Place It
How a stop loss works in forex, how to set one step by step, common ways to choose the stop level, and why a stop can close at a worse price.
- Forex Trading Plan: How to Write One, With a Template
What a forex trading plan is and how to write one: what it should include, risk rules, a fill-in template, an example plan and how to test and update it.
- Risk-Reward Ratio in Forex: How to Calculate It, With Examples
What the risk-reward ratio is, how to calculate it for long and short trades, the break-even win rate for each ratio, and why a high ratio alone is not enough.
- MACD Indicator Explained: MACD Line, Signal Line and Histogram
The MACD indicator explained: how the MACD line, signal line and histogram are calculated (12, 26, 9), crossovers, the zero line, divergence and its limits.
Glossary terms
- Volatility
Volatility is how much and how quickly a currency pair’s price moves over a period. Higher volatility means larger price swings and, for the same position size, greater risk.
- Stop loss
A stop loss is an order that closes a position automatically if the price moves against you to a set level. It is designed to limit the loss on a trade, but it does not guarantee the exit price.
First published 18 October 2026. Last fact-checked 18 October 2026.This article is for educational purposes only and is not investment advice.