RSI Indicator Explained: Formula, 70 and 30 Levels, Divergence
The Relative Strength Index (RSI) is a momentum oscillator that compares the size of recent gains with recent losses and scales the result from 0 to 100. J. Welles Wilder introduced it in 1978 with a 14-period setting. Readings above 70 are conventionally called overbought and below 30 oversold, but in strong trends RSI can stay there for a long time: the levels describe past momentum and do not predict a reversal.
Key takeaways
- RSI compares average gains with average losses over a period and scales the result from 0 to 100.
- J. Welles Wilder introduced it in 1978 and used 14 periods; it remains the common default.
- Above 70 is conventionally called overbought and below 30 oversold; in a strong trend RSI can stay beyond these levels for a long time.
- Divergence, when price makes a new high or low and RSI does not, shows slowing momentum, not a reversal on its own.
- RSI is a measure of past momentum; it does not predict the next move and is best used inside a plan with a stop.
At a glance
- Scale
- 0 to 100
- Default setting
- 14 periods (Wilder, 1978)
- Overbought / oversold
- Above 70 / below 30
- Main limit
- Can stay extreme in trends
What is the RSI indicator?
The Relative Strength Index (RSI) is a momentum oscillator. It compares the size of recent price gains with the size of recent losses and shows the result on a scale from 0 to 100. J. Welles Wilder introduced it in his 1978 book New Concepts in Technical Trading Systems, using 14 periods, and that setting remains the common default.
RSI is shown in a separate panel below the price chart. High readings mean recent gains have outweighed recent losses; low readings mean the opposite.
How is RSI calculated?
RS = average gain ÷ average loss (over n periods) · RSI = 100 − 100 ÷ (1 + RS)
- For each period, take the change in closing price. A rise counts as a gain (the loss is 0); a fall counts as a loss, as a positive number (the gain is 0).
- The first average gain and average loss are simple averages over the first 14 periods.
- After that, Wilder’s smoothing updates each average: new average = (previous average × 13 + current value) ÷ 14.
- Divide the average gain by the average loss to get RS, then convert RS to the 0 to 100 scale.
RSI step by step
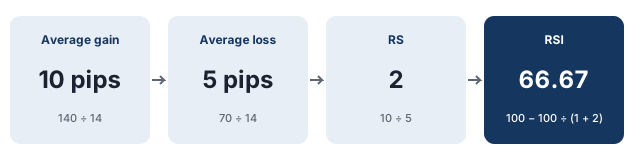
Assumptions: a 14-period RSI; over the first 14 periods, gains add up to 140 pips and losses to 70 pips (illustrative figures).
- Average gain = 140 ÷ 14 = 10 pips; average loss = 70 ÷ 14 = 5 pips.
- RS = 10 ÷ 5 = 2; RSI = 100 − 100 ÷ (1 + 2) ≈ 66.67.
- The next period closes 6 pips higher. New average gain = (10 × 13 + 6) ÷ 14 ≈ 9.714; new average loss = (5 × 13 + 0) ÷ 14 ≈ 4.643.
- RS ≈ 9.714 ÷ 4.643 ≈ 2.092; RSI ≈ 100 − 100 ÷ 3.092 ≈ 67.66.
Because of the smoothing, RSI values depend on how much history the platform uses, so readings can differ slightly between platforms.
RSI 70 and 30: overbought and oversold
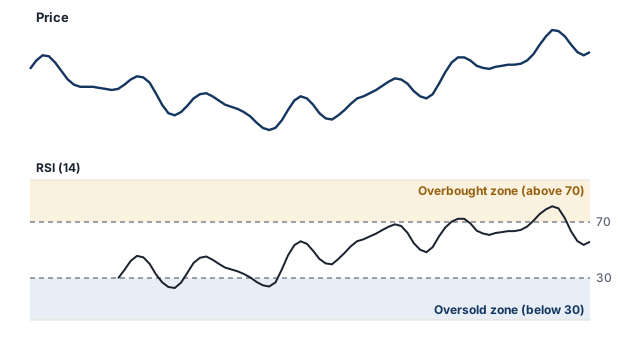
By convention, RSI above 70 is called overbought and below 30 oversold. These labels describe how strong recent gains or losses have been, not what will happen next:
- In a strong uptrend, RSI can stay above 70 for a long time while the price keeps rising.
- In a strong downtrend, RSI can stay below 30 while the price keeps falling.
Selling every time RSI crosses 70, or buying every time it falls below 30, means trading against the trend whenever the trend is strong. Some traders adjust the levels (80 and 20, for example) or only take readings in the direction of a longer-term trend: moving averages.
RSI divergence
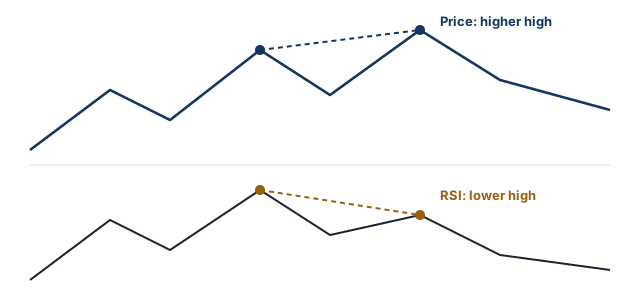
Divergence is when price and RSI disagree:
- Bearish divergence: price makes a higher high, but RSI makes a lower high.
- Bullish divergence: price makes a lower low, but RSI makes a higher low.
Divergence shows that momentum is slowing. It does not say when, or whether, the price will turn; a trend can continue through several divergences.
RSI settings
| Setting | Effect |
|---|---|
| Shorter (such as 7 or 9) | More sensitive; reaches 70 and 30 more often |
| 14 (Wilder’s setting) | The common default |
| Longer (such as 21 or 25) | Smoother; reaches 70 and 30 less often |
No setting is best in general. Whatever is chosen should be tested on past data and on a demo account before real money is used: forex demo account.
Limits of RSI
- Past momentum only: RSI is calculated from past closes and does not forecast.
- Trends: overbought and oversold readings can last a long time.
- Research: technical analysis is widespread in the foreign exchange market, and a 2007 review in the Journal of Economic Literature reported that it “may be profitable”. That is a finding about the field in general, not evidence that any RSI rule works for a retail trader after costs.
If used, RSI belongs inside a written plan that sets the stop and position size before entry, for example combined with support and resistance: stop loss, trading plan.
Free email course
Forex Risk Management in 5 Days
A free five-day email course: risk per trade, stop losses, position sizing, risk-reward and drawdowns, with a worked example each day.
Frequently asked questions
What is the RSI indicator?
The Relative Strength Index is a momentum oscillator, introduced by J. Welles Wilder in 1978, that compares the size of recent gains with recent losses and shows the result on a scale from 0 to 100.
What does RSI above 70 mean?
That recent gains have been much larger than recent losses: the market is conventionally called overbought. It does not mean the price must fall; in a strong uptrend RSI can stay above 70 for a long time.
What does RSI below 30 mean?
That recent losses have been much larger than recent gains: conventionally oversold. In a strong downtrend RSI can stay below 30 while the price keeps falling; the reading describes past momentum and does not predict a rise.
What is the best RSI setting?
There is no best setting. Wilder used 14 periods and it remains the common default. Shorter settings make RSI more sensitive and reach 70 and 30 more often; longer settings make it smoother. Test any setting before using it with real money.
What is RSI divergence?
When price makes a higher high but RSI makes a lower high (bearish divergence), or price makes a lower low but RSI a higher low (bullish divergence). It shows that momentum is slowing; trends can continue for a long time despite divergence.
How is RSI calculated?
RS = average gain ÷ average loss over the period, and RSI = 100 − 100 ÷ (1 + RS). With an average gain of 10 pips and an average loss of 5 pips, RS = 2 and RSI = 100 − 100 ÷ 3 ≈ 66.67.
Sources
Regulatory and official sources
- The Obstinate Passion of Foreign Exchange Professionals: Technical Analysis (Journal of Economic Literature, 2007), American Economic Association
Industry and news sources
- Relative Strength Index (RSI), StockCharts ChartSchool
Related articles
- Moving Averages in Forex: SMA vs EMA, Periods and Crossovers
Moving averages in forex explained: how SMA and EMA are calculated, worked examples, common periods (20, 50, 200), crossovers, golden cross and their limits.
- Support and Resistance in Forex: How to Find and Use Levels
Support and resistance in forex explained: how to find levels on a chart, why they are zones, breakouts and false breakouts, and placing a stop with an example.
- Stop Loss in Forex: How to Set One and Where to Place It
How a stop loss works in forex, how to set one step by step, common ways to choose the stop level, and why a stop can close at a worse price.
- Forex Trading Plan: How to Write One, With a Template
What a forex trading plan is and how to write one: what it should include, risk rules, a fill-in template, an example plan and how to test and update it.
- Risk-Reward Ratio in Forex: How to Calculate It, With Examples
What the risk-reward ratio is, how to calculate it for long and short trades, the break-even win rate for each ratio, and why a high ratio alone is not enough.
- MACD Indicator Explained: MACD Line, Signal Line and Histogram
The MACD indicator explained: how the MACD line, signal line and histogram are calculated (12, 26, 9), crossovers, the zero line, divergence and its limits.
Glossary terms
- Volatility
Volatility is how much and how quickly a currency pair’s price moves over a period. Higher volatility means larger price swings and, for the same position size, greater risk.
- Stop loss
A stop loss is an order that closes a position automatically if the price moves against you to a set level. It is designed to limit the loss on a trade, but it does not guarantee the exit price.
First published 18 October 2026. Last fact-checked 18 October 2026.This article is for educational purposes only and is not investment advice.