Fibonacci Retracement in Forex: Levels, How to Draw, Example
Fibonacci retracement levels mark how far a price may pull back after a move, as a percentage of that move: typically 23.6%, 38.2%, 50% and 61.8%. Three of these come from ratios in the Fibonacci sequence; 50% does not. The levels are drawn from the swing low to the swing high of a move (or the reverse) and used as possible support or resistance; price can stop at any level or none.
Key takeaways
- Fibonacci retracements mark pullback levels as a percentage of a prior move; charting tools typically draw 23.6%, 38.2%, 50% and 61.8%.
- 23.6%, 38.2% and 61.8% come from ratios between numbers in the Fibonacci sequence; 50% is not a Fibonacci ratio.
- In an uptrend the levels are drawn from the swing low to the swing high; in a downtrend from the high to the low.
- Retracement price = high − (high − low) × ratio after a rise.
- The levels are possible support or resistance, not predictions; which swing to measure is a judgement call.
At a glance
- Typical levels
- 23.6, 38.2, 50, 61.8%
- Drawn
- Between a swing low and high
- 50% level
- Not a Fibonacci ratio
- Main limit
- Depends on the swing chosen
What is Fibonacci retracement?
Fibonacci retracement is a way of marking how far a price may pull back after a move, as a percentage of that move. After EUR/USD rises from 1.0800 to 1.1000, for example, a 50% retracement would take it back to 1.0900. Charting tools typically draw 23.6%, 38.2%, 50% and 61.8%, and draw them automatically between two points you choose.
Traders use the levels as possible support after a rise or resistance after a fall: support and resistance.
Where do the Fibonacci levels come from?
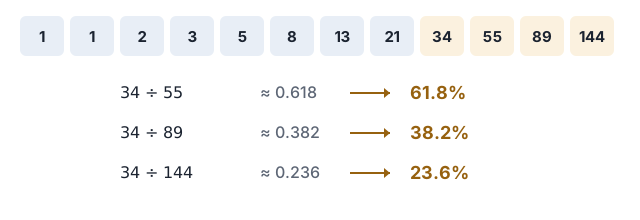
The Fibonacci sequence starts 1, 1, 2, 3, 5, 8, 13, 21, 34, 55, 89, 144, and each number is the sum of the two before it. The Italian mathematician Leonardo of Pisa, known as Fibonacci, is credited with introducing it to the West. Ratios between its numbers settle towards fixed values:
| Ratio | Example | Level |
|---|---|---|
| A number ÷ the next | 34 ÷ 55 ≈ 0.618 | 61.8% |
| A number ÷ the one two places on | 34 ÷ 89 ≈ 0.382 | 38.2% |
| A number ÷ the one three places on | 34 ÷ 144 ≈ 0.236 | 23.6% |
The 50% level is not a Fibonacci ratio; it is included because a pullback of about half a move is a long-standing idea in technical analysis, going back to Dow Theory.
How to calculate and draw Fibonacci retracement levels
In an uptrend, draw from the swing low to the swing high; in a downtrend, from the swing high to the swing low. The levels sit between the two points:
After a rise: level = high − (high − low) × ratio · after a fall: level = low + (high − low) × ratio
Retracement levels of a EUR/USD rise (illustrative prices)
Assumptions: EUR/USD rises from a swing low of 1.0800 to a swing high of 1.1000, a move of 0.0200 (200 pips).
- 23.6%: 1.1000 − 0.0200 × 0.236 ≈ 1.0953
- 38.2%: 1.1000 − 0.0200 × 0.382 ≈ 1.0924
- 50%: 1.1000 − 0.0200 × 0.5 = 1.0900
- 61.8%: 1.1000 − 0.0200 × 0.618 ≈ 1.0876
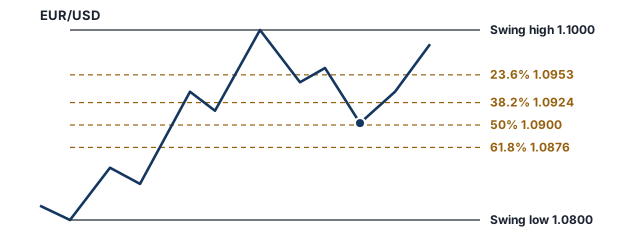
The hardest part is choosing the swing. Two traders measuring different highs and lows get different levels, which is one reason the levels are a guide rather than exact prices.
Using Fibonacci levels with a stop loss
A retracement level can mark where a trade is planned, with the stop beyond the next level and the position sized from that distance: position sizing.
A long trade at the 50% level (illustrative prices)
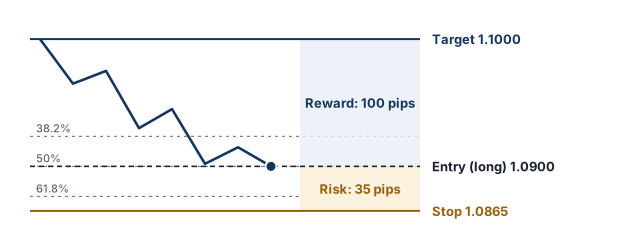
Assumptions: the EUR/USD rise above; $10,000 US dollar account; risk 1% ($100); entry at the 50% level, 1.0900; stop at 1.0865, below the 61.8% level; target at the swing high, 1.1000; one pip on 1 standard lot is worth $10; spread, commission and swap excluded.
- Stop distance: 1.0900 − 1.0865 = 35 pips. Target distance: 1.1000 − 1.0900 = 100 pips.
- Position size: $100 ÷ (35 × $10) ≈ 0.286, rounded down to 0.28 lots.
- If the stop is hit: 35 × $10 × 0.28 = $98 loss. If the target is hit: 100 × $10 × 0.28 = $280 profit.
Gaps and slippage can make a loss larger than planned: risk-reward ratio, position size calculator.
Limits of Fibonacci retracement
- Subjective swings: the levels depend on which high and low are chosen.
- Many levels: with four or five levels close together, price will usually be near one of them, which can make them look more accurate in hindsight than they are.
- No forecast: price can turn at any level or pass through all of them.
- Research: a 2007 review in the Journal of Economic Literature found technical analysis widespread in currency markets and reported that it “may be profitable”; that does not show that Fibonacci levels work for a retail trader after costs.
Write the levels, the stop and the risk into the plan before entry: stop loss.
Free email course
Forex Risk Management in 5 Days
A free five-day email course: risk per trade, stop losses, position sizing, risk-reward and drawdowns, with a worked example each day.
Frequently asked questions
What is Fibonacci retracement in forex?
A way of marking how far a price may pull back after a move, using percentages of that move: typically 23.6%, 38.2%, 50% and 61.8%. Traders use the levels as possible support in an uptrend or resistance in a downtrend.
How do you calculate Fibonacci retracement levels?
After a rise, level = high − (high − low) × ratio. For a EUR/USD rise from 1.0800 to 1.1000 (illustrative prices), the 38.2% level is 1.1000 − 0.0200 × 0.382 ≈ 1.0924 and the 61.8% level is about 1.0876.
Where do the Fibonacci ratios come from?
From the Fibonacci sequence (1, 1, 2, 3, 5, 8, 13, 21, 34…). A number divided by the next approaches 0.618, by the one two places on approaches 0.382 and by the one three places on approaches 0.236. The 50% level is not a Fibonacci ratio.
How do you draw Fibonacci retracement?
In an uptrend, select the Fibonacci tool and draw from the swing low to the swing high; in a downtrend, from the swing high to the swing low. The platform then plots the levels between the two points.
Which Fibonacci level is the most important?
None is reliably more important. StockCharts describes 38.2% and 61.8% as the most popular levels and includes 50% among its four standard levels. Price can turn at any level or pass through all of them.
Does Fibonacci retracement work?
The levels are a way to mark possible turning areas, not a forecast. Different traders measure different swings and get different levels, and price can ignore them. Treat them as places to plan a stop and size, not as signals.
Sources
Regulatory and official sources
- The Obstinate Passion of Foreign Exchange Professionals: Technical Analysis (Journal of Economic Literature, 2007), American Economic Association
Industry and news sources
- Fibonacci Retracements, StockCharts ChartSchool
Related articles
- Support and Resistance in Forex: How to Find and Use Levels
Support and resistance in forex explained: how to find levels on a chart, why they are zones, breakouts and false breakouts, and placing a stop with an example.
- Moving Averages in Forex: SMA vs EMA, Periods and Crossovers
Moving averages in forex explained: how SMA and EMA are calculated, worked examples, common periods (20, 50, 200), crossovers, golden cross and their limits.
- Risk-Reward Ratio in Forex: How to Calculate It, With Examples
What the risk-reward ratio is, how to calculate it for long and short trades, the break-even win rate for each ratio, and why a high ratio alone is not enough.
- Position Sizing in Forex: How Many Lots Should You Trade?
How to calculate position size in forex from your risk amount, stop loss distance and pip value, with worked examples for EUR/USD and USD/JPY.
- Stop Loss in Forex: How to Set One and Where to Place It
How a stop loss works in forex, how to set one step by step, common ways to choose the stop level, and why a stop can close at a worse price.
Glossary terms
- Stop loss
A stop loss is an order that closes a position automatically if the price moves against you to a set level. It is designed to limit the loss on a trade, but it does not guarantee the exit price.
- Take profit
A take profit is an order that closes a position automatically when the price reaches a set profit target.
First published 18 October 2026. Last fact-checked 18 October 2026.This article is for educational purposes only and is not investment advice.