Candlestick Patterns: How to Read Forex Candlestick Charts
A candlestick shows a period's open, high, low and close: the body spans open to close and the wicks reach the high and low. Candlestick patterns are shapes of one to three candles, such as the doji, hammer, shooting star and engulfing patterns, that describe how buyers and sellers moved the price in that period. They need context, such as the trend before them, and do not predict the next move.
Key takeaways
- Each candle shows the open, high, low and close of one period; the body spans open to close and the wicks reach the high and low.
- A bullish candle closes above its open; a bearish candle closes below it. Colours differ between platforms.
- A doji has almost equal open and close; on its own it is neutral and shows indecision.
- Hammers, shooting stars and engulfing patterns are called reversal patterns only after a prior trend, and candlestick references treat them as needing confirmation from the next candles.
- Patterns describe one to three periods of past trading; they do not predict the next move.
At a glance
- One candle
- Open, high, low, close
- Bullish candle
- Closes above the open
- Doji
- Open ≈ close: neutral alone
- Reversal patterns
- Need a prior trend
What is a candlestick chart?
A candlestick chart shows price as a series of candles, one for each period: one hour on a 1-hour chart, one day on a daily chart. Each candle shows four prices for that period: the open, the high, the low and the close. Candlestick charts trace back to Japanese rice trading. StockCharts, citing Steve Nison, describes a rice trader named Homma from the town of Sakata as a legendary figure in their development, and Nison’s book Japanese Candlestick Charting Techniques introduced them to many Western traders.
How to read a candlestick
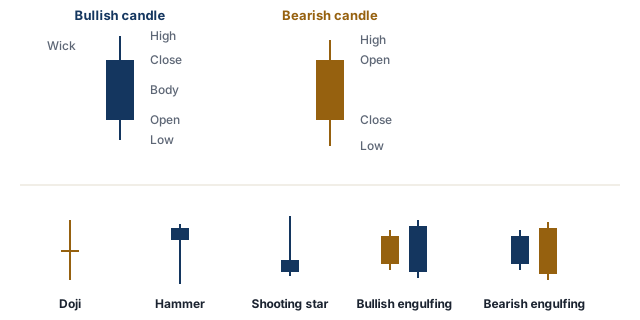
- Body: the thick part, from the open to the close.
- Bullish candle: the close is above the open, so the price rose during the period.
- Bearish candle: the close is below the open, so the price fell.
- Wicks (shadows): the thin lines above and below the body, reaching the period’s high and low.
Platforms use different colours: green and red, white and black, or others. A long body shows a large move from open to close; long wicks show that the price moved far from the open and close during the period but came back.
Common candlestick patterns
| Pattern | Shape | Where it is read as a possible reversal |
|---|---|---|
| Doji | Open and close almost equal; thin body | Neutral on its own; read with the prior trend |
| Hammer | Small body near the top, lower wick about twice the body or more | After a decline |
| Shooting star | Small body near the bottom, upper wick about twice the body or more | After a rise |
| Bullish engulfing | A rising body that completely covers the previous falling body | After a decline |
| Bearish engulfing | A falling body that completely covers the previous rising body | After a rise |
Doji. The open and close are equal or nearly so. Price moved during the period but ended where it started: neither buyers nor sellers ended in control. On its own a doji is neutral.
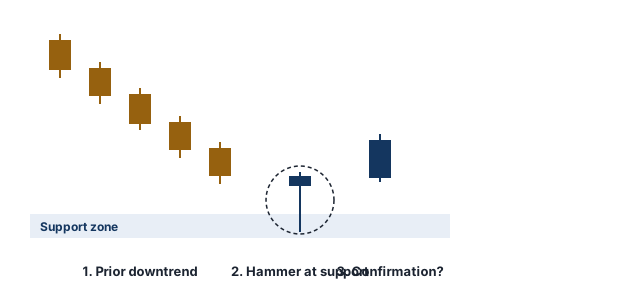
Hammer. After a decline, sellers push the price well below the open, but buyers bring it back near the top of the range by the close. The same shape after a rise is called a hanging man.
Shooting star. After a rise, buyers push the price well above the open, but it closes back near the low of the range.
Engulfing patterns. In a bullish engulfing, a rising candle’s body completely covers the body of the falling candle before it. A bearish engulfing is the reverse. A bullish engulfing at a new high, after a long rise, is not a reversal pattern; there is no downtrend to reverse.
Context and confirmation
A candlestick pattern describes one to three periods. The same shape can mean different things in different places:
- Prior trend: a reversal pattern needs a trend to reverse.
- Location: a hammer at a well-defined support zone tells a different story from one in the middle of a range: support and resistance.
- Confirmation: references such as StockCharts ChartSchool treat reversal patterns as needing confirmation within one to three periods, such as a further move in the new direction. Without it, the pattern is only a sign of hesitation.
Limits of candlestick patterns
- No forecast: a pattern summarises past trading; the next candle can go either way.
- Definitions vary: sources differ on how small a doji’s body or how long a hammer’s wick must be.
- Timeframe: patterns on low timeframes form often and reflect short-term noise.
- Forex specifics: the forex market trades almost continuously from Monday to Friday, so a daily candle usually opens near the previous close; the main exception is a gap at the weekly open. Patterns defined by gaps between candles therefore appear less often than on stock charts. The daily candle’s closing time also depends on the broker’s server time, so the same day can produce different candles on different platforms.
If used, candlestick patterns belong inside a written plan with a stop and position size set before entry: stop loss, trading plan.
Free email course
Forex Risk Management in 5 Days
A free five-day email course: risk per trade, stop losses, position sizing, risk-reward and drawdowns, with a worked example each day.
Frequently asked questions
How do you read a candlestick?
The body shows the open and close of the period: if the close is above the open the candle is bullish, if below it is bearish. The thin lines above and below the body, called wicks or shadows, reach the period's high and low.
What is a doji candle?
A candle whose open and close are equal or almost equal, so the body is a thin line. It shows that neither buyers nor sellers ended the period in control. On its own it is neutral; its meaning depends on the trend before it and what follows.
What is a hammer candlestick?
A candle with a small body near the top of its range and a long lower wick, at least about twice the body, that forms after a decline. It shows that sellers pushed the price down but buyers brought it back up before the close. Candlestick references treat it as needing confirmation.
What is an engulfing pattern?
A two-candle pattern in which the second candle's body completely covers the first candle's body and has the opposite colour. A bullish engulfing forms after a decline, with a rising candle covering a falling one; a bearish engulfing is the reverse after a rise.
Which timeframe is best for candlestick patterns?
There is no best one. Each candle summarises one period, so a pattern on a daily chart describes days of trading and one on a 5-minute chart only minutes. Patterns on lower timeframes form more often and are more affected by short-term noise.
Are candlestick patterns reliable?
They describe how price moved in one to three periods; they do not predict what comes next. Patterns are judged in context, such as the prior trend and nearby support or resistance, and should be part of a plan with a stop.
Sources
Industry and news sources
- Introduction to Candlesticks, StockCharts ChartSchool
- Candlestick Bullish Reversal Patterns, StockCharts ChartSchool
- Candlestick Pattern Dictionary, StockCharts ChartSchool
Related articles
- Support and Resistance in Forex: How to Find and Use Levels
Support and resistance in forex explained: how to find levels on a chart, why they are zones, breakouts and false breakouts, and placing a stop with an example.
- RSI Indicator Explained: Formula, 70 and 30 Levels, Divergence
The RSI indicator explained: how the Relative Strength Index is calculated step by step, what 70 and 30 mean, the 14-period setting, divergence and its limits.
- Moving Averages in Forex: SMA vs EMA, Periods and Crossovers
Moving averages in forex explained: how SMA and EMA are calculated, worked examples, common periods (20, 50, 200), crossovers, golden cross and their limits.
- Stop Loss in Forex: How to Set One and Where to Place It
How a stop loss works in forex, how to set one step by step, common ways to choose the stop level, and why a stop can close at a worse price.
- Forex Trading Plan: How to Write One, With a Template
What a forex trading plan is and how to write one: what it should include, risk rules, a fill-in template, an example plan and how to test and update it.
Glossary terms
- Volatility
Volatility is how much and how quickly a currency pair’s price moves over a period. Higher volatility means larger price swings and, for the same position size, greater risk.
- Stop loss
A stop loss is an order that closes a position automatically if the price moves against you to a set level. It is designed to limit the loss on a trade, but it does not guarantee the exit price.
First published 18 October 2026. Last fact-checked 18 October 2026.This article is for educational purposes only and is not investment advice.