The 1% Rule in Trading: How Much to Risk Per Trade
The 1% rule in trading is a risk guideline under which a trader risks no more than 1% of the account on a single trade, meaning the planned loss if the stop loss is hit. It limits risk, not position value: the position size is calculated from the 1% amount and the stop distance. The rule does not make a strategy profitable, and gaps or slippage can push a loss beyond 1%.
Key takeaways
- Under the 1% rule, the planned loss on a single trade, if the stop loss is hit, is no more than 1% of the account.
- The 1% applies to the amount at risk, not to the size or value of the position.
- Position size = 1% of the account ÷ (stop distance in pips × pip value per standard lot).
- Recalculating the 1% from the current balance makes the risk amount shrink in a drawdown and grow after gains.
- Gaps, slippage and correlated positions can make the realised loss or the combined risk larger than 1%.
Watch: the short version
The 1% Rule in Trading: How Much to Risk Per Trade
Narration: AI voice. Educational only, not investment advice.
At a glance
- Risk per trade
- 1% of the account
- On a $5,000 account
- $50 per trade
- Lot size
- From the stop distance
- Realised loss
- Can exceed 1% (gaps, slippage)
What is the 1% rule in trading?
The 1% rule is a risk guideline: the planned loss on any single trade, the amount lost if the stop loss is hit, is limited to 1% of the trading account. On a $5,000 account that is $50 per trade. It is one of several fixed-percentage approaches, which may use limits such as 0.5%, 1% or 2%. The idea behind all of them is the same: keeping the loss from any single trade small relative to the account, so that a series of losses does not reduce it too quickly.
The rule concerns risk, not position value. A trade risking 1% of the account can involve a position worth many times the account balance, depending on the stop distance and leverage.
How to apply the 1% rule in trading
Applying it takes three steps:
- Calculate 1% of the account: for example, $5,000 × 1% = $50.
- Set the stop loss. A common approach is to set the stop near the level where the setup would be considered invalid, then measure the distance in pips: stop loss.
- Calculate the position size so that the stop distance multiplied by the pip value equals the 1% amount: position sizing.
lots = (account × 1%) ÷ (stop distance in pips × pip value per standard lot)
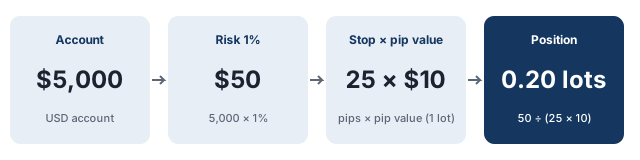
1% rule example: EUR/USD
Assumptions: account $5,000, EUR/USD on a USD account, pip value $10 per standard lot, 25-pip stop loss.
- Risk amount: $5,000 × 1% = $50
- Position size: 50 ÷ (25 × 10) = 0.20 lots
If the stop is hit, the loss is about $50 before spread, commission and slippage.
Why is the 1% not the position size?
Because the position size depends on the stop distance. With the same $50 risk, a tighter stop allows a larger position:
Same 1% risk, different stop distances
Assumptions: account $5,000, risk $50, EUR/USD at 1.0850, pip value $10 per standard lot.
- 50-pip stop: 50 ÷ (50 × 10) = 0.10 lots, a position of about $10,850 (effective leverage about 2.2:1)
- 5-pip stop: 50 ÷ (5 × 10) = 1.00 lot, a position of about $108,500 (effective leverage about 21.7:1)
Both trades risk 1% before costs if the stop is filled at its level. The second requires much more margin, and a given amount of slippage represents a larger fraction of its planned stop distance: leverage.
Should the 1% be based on the starting or the current balance?
Both methods exist, but they produce different risk paths during gains and drawdowns. Recalculating the 1 percent rule amount from the current balance after every trade, often called fixed fractional position sizing, makes the risk amount shrink during a drawdown and grow after gains. Keeping it fixed to the starting balance keeps the dollar risk constant, so each loss during a drawdown is a larger share of the remaining account.
Recalculating 1% after losses
Starting balance $5,000, three losing trades at 1% of the current balance:
- Trade 1: risk $50.00, balance afterwards $4,950.00
- Trade 2: risk $49.50, balance afterwards $4,900.50
- Trade 3: risk $49.01, balance afterwards $4,851.50
What are the limits of the 1% rule?
- It does not create an edge. Risking 1% per trade controls how fast losses accumulate; whether a strategy makes money depends on its win rate, average win, average loss and costs: risk-reward ratio.
- The realised loss can exceed 1%. A standard stop loss does not guarantee the exit price: gaps, slippage and execution beyond the intended stop can cause the realised loss to exceed 1%, and spread widening can also trigger the stop sooner.
- Correlated positions can create combined risk. Several open positions that each risk 1% can move together, for example trades in different pairs that share the US dollar, so the combined risk can be well above 1%. Correlation between pairs is not constant, so this overlap changes over time. A separate portfolio-level risk cap can be used to limit combined open risk.
- Prop firm loss limits work on a different basis. Daily and maximum drawdown limits are measured against the account’s starting or peak value, so the number of 1% losses an account can absorb is fixed in advance: prop firm drawdown rules.
- Minimum lot size can limit the 1% rule. If the broker’s minimum position is 0.01 lots, the smallest risk on EUR/USD with a 25-pip stop is about $2.50 (USD account). On a $200 account, 1% is $2, so even the smallest possible position would risk about 1.25%. The trader may then need to accept a higher percentage risk, use a different instrument or account structure, or not take the trade.
The position size calculator works out the lot size from the risk percentage, stop distance and pair, so the 1% risk rule can be applied to any trade.
Free email course
Forex Risk Management in 5 Days
A free five-day email course: risk per trade, stop losses, position sizing, risk-reward and drawdowns, with a worked example each day.
Frequently asked questions
Does the 1% rule mean I can only trade 1% of my account?
No. It limits the amount you would lose if the stop loss is hit to 1% of the account; the position itself can be much larger than 1% of the account.
How much is 1% risk on a $1,000 account?
$10 per trade. With a 20-pip stop on EUR/USD and a pip value of $10 per standard lot (USD account), that is a position of 10 ÷ (20 × 10) = 0.05 lots.
Should I risk 1% or 2% per trade?
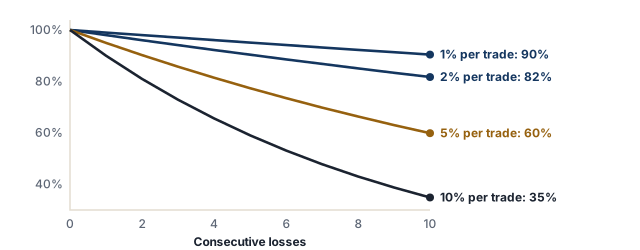
There is no single correct figure. The difference shows in losing streaks; after 10 consecutive full losses an account risking 1% of the current balance is at about 90% of its starting value, and one risking 2% at about 82%.
How does the 1% rule work with prop firm limits?
Prop firm challenges set daily and maximum loss limits, for example 5% daily and 10% maximum on FTMO's 2-Step challenge. At 1% risk per trade, five consecutive full losses in one day would reach a 5% daily limit, before costs and slippage.
What is the 2% rule?
A fixed-percentage risk rule that caps the planned loss at 2% of the account per trade. A higher percentage makes a losing streak reduce the account faster.
Does the 1% rule work for small accounts?
The principle can be applied to accounts of different sizes, but minimum lot sizes and transaction costs can make exact implementation difficult on very small accounts.
Related articles
- Position Sizing in Forex: How Many Lots Should You Trade?
How to calculate position size in forex from your risk amount, stop loss distance and pip value, with worked examples for EUR/USD and USD/JPY.
- Stop Loss in Forex: How to Set One and Where to Place It
How a stop loss works in forex, how to set one step by step, common ways to choose the stop level, and why a stop can close at a worse price.
- Risk-Reward Ratio in Forex: How to Calculate It, With Examples
What the risk-reward ratio is, how to calculate it for long and short trades, the break-even win rate for each ratio, and why a high ratio alone is not enough.
- What Is Leverage in Forex? How It Works, Ratios and Limits
What is leverage in forex? How leverage ratios such as 1:30, 1:100 and 1:500 work, how margin is calculated, effective leverage and retail limits.
Glossary terms
- Fixed fractional position sizing
Fixed fractional position sizing risks a fixed percentage of the current account balance on each trade, so the amount at risk is recalculated as the balance changes.
- Drawdown
A drawdown is the decline in an account's value from a peak to a subsequent low, usually expressed as a percentage of the peak.
- Stop loss
A stop loss is an order that closes a position automatically if the price moves against you to a set level. It is designed to limit the loss on a trade, but it does not guarantee the exit price.
- Lot
A lot is a standardised trade size in forex. A standard lot is 100,000 units of the base currency, a mini lot 10,000 units and a micro lot 1,000 units.
First published 1 October 2026. Last fact-checked 4 October 2026.This article is for educational purposes only and is not investment advice.